Welcome to Niagara Falls, Ontario Canada
![Niagara Falls flowing]()
Top Stories
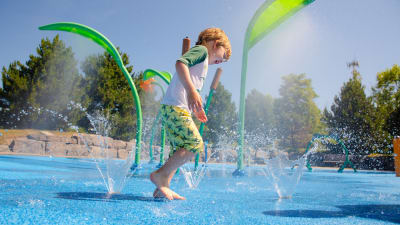
![Child having fun in a splash pad]()
MacBain Splash Pad open for the season!
The MacBain Splash Pad is now open! Remaining splash pads will open in early June.Read more!["Niagara Falls Farmers' Market: New Location"]()
Niagara Falls Farmers' Market opens at The Exchange: Saturday, May 18
The Niagara Falls Farmers’ Market will open at its new permanent location, The Exchange (5943 ...Read more![Photo of the Arts & Culture Wall of Fame]()
City of Niagara Falls looking to rehome Arts & Culture Wall of Fame plaques
The City is looking to provide inductees (or their respective family members and friends) with ...Read more![Photo of kids skateboarding.]()
City of Niagara Falls Summer Camp Pilot: Register today!
The City of Niagara Falls is excited to launch a summer camp pilot program in 2024 that will offer ...Read more![Touch-A-Truck. Graphic of trucks lined up.]()
City of Niagara Falls Touch-A-Truck Event: Saturday, May 25
To celebrate National Public Works Week, The City of Niagara Falls will once again host the ...Read more!["National Public Works Weel"]()
National Public Works Week: May 19 - 25
From Sunday, May 19 to Saturday, May 25, the City of Niagara Falls will recognize National Public ...Read more!["2024 Adult Fitness Programs at MacBain Community Centre"]()
Adult Fitness Programs At The MacBain Community Centre
This Spring, join the City of Niagara Falls at the MacBain Community Centre (7150 Montrose Road) ...Read more!["June is Seniors Month"]()
Seniors Month in Niagara Falls
Celebrate Seniors Month during the month of June with free events, seminars, and workshops offered ...Read more![Photo of the dome at John N Allan Park]()
Let's Talk Proposed Year-Round Dome at John N. Allan Park
We want to hear from you! The Tennis Clubs of Canada submitted a proposal to the City to keep the ...Read more![Our Niagara Falls Plan Let's Talk Page]()
Our Niagara Falls Plan
We're creating a new Official Plan – a new long-term land use vision that will guide us through ...Read more![The Recreation Committee Golf Tournament]()
Recreation Committee Golf Tournament: June 22, 2024
Support the Activity Subsidy Fund - register a foursome or donate now!Read more![Photo of hopscotch, person playing baseball, and person playing pickleball]()
Let's Talk WL Houck Park Improvements
We want to hear from you! The City of Niagara Falls, in collaboration with the Canada Summer Games ...Read more![Niagara Falls Public Library]()
Niagara Falls Public Library to permanently close Chippawa building
The Niagara Falls Public Library Board has made the difficult decision to permanently close the ...Read more![pothole]()
Report a Pothole Online
Report potholes in 3 short steps with our online form. For regional roads, go to niagararegion.ca ...Read more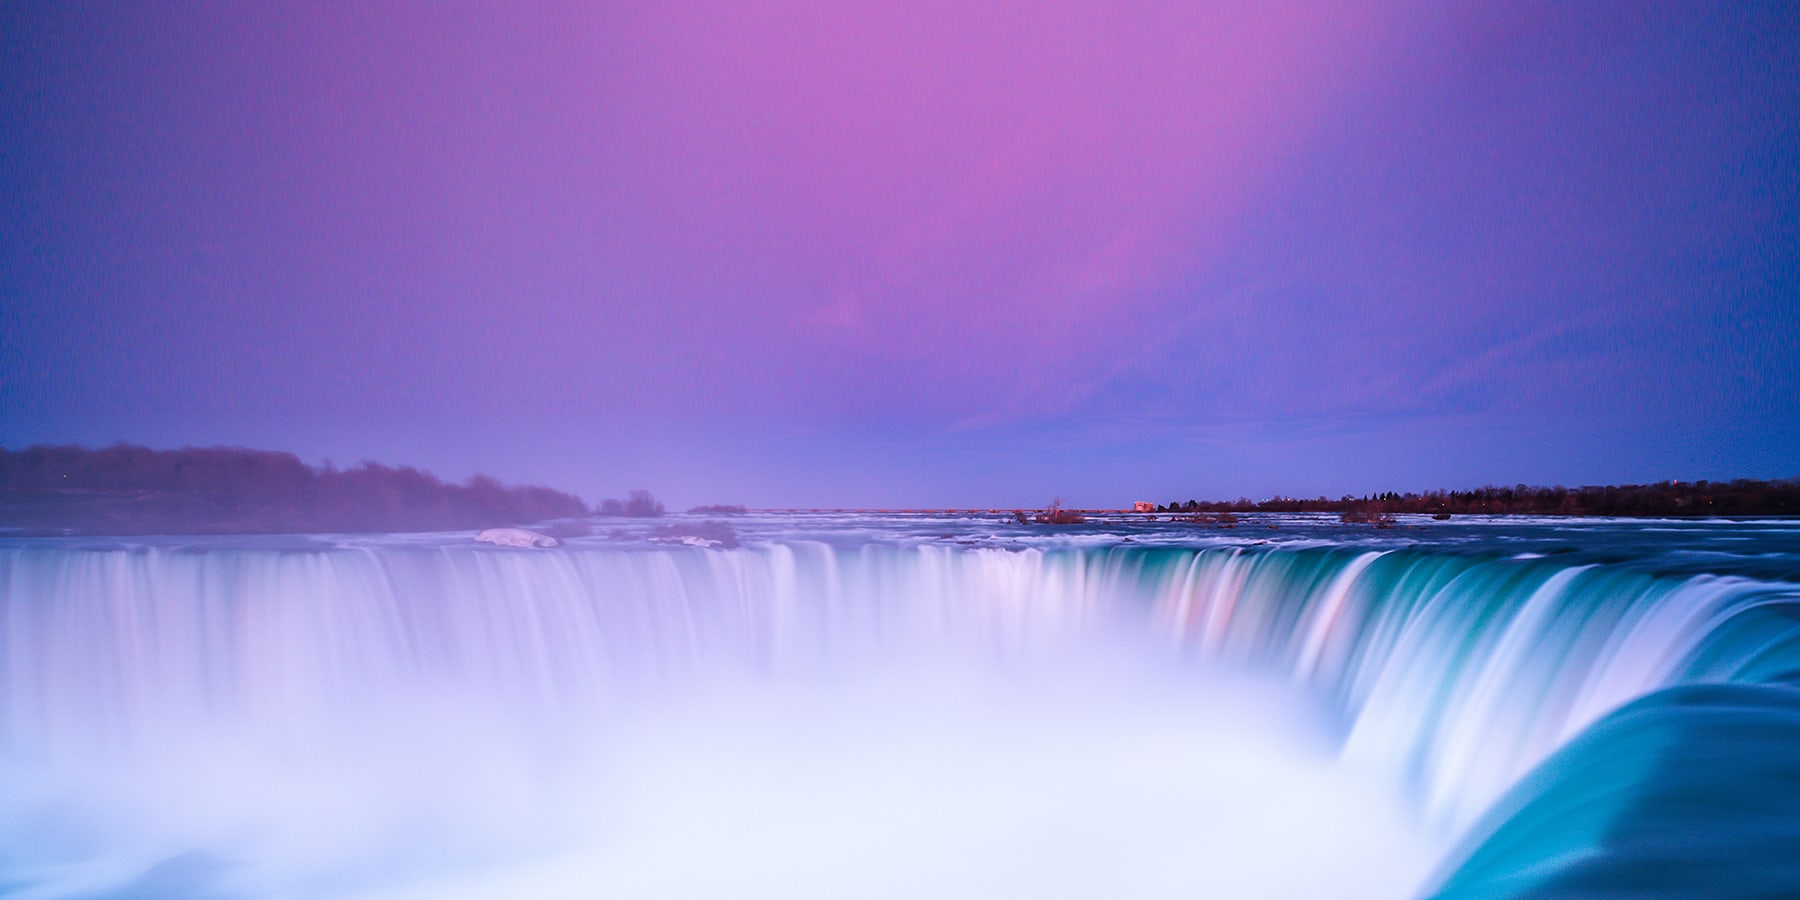
 Careers & Employment
 City Hall Departments
 Parking
 MyCity Dashboard
 Bids & Tenders
 Contact the City
 Public Notices
 Transit Services
 Visitors & Tourism